
Tempo HA docs - How to enable correlation from traces to logs
Grafana supports a trace-to-log correlation feature that lets you jump directly from a span in a trace view directly to logs relevant for that span to make troubleshooting issues easier.
See more: Grafana traces-to-logs
For this feature to work, Grafana needs a way to connect traces to their corresponding logs. It does this by extracting the trace ID from the selected span and querying the configured logging data source (i.e. Loki) for log lines that include the same trace ID value. This means the workload managed by the charm must be instrumented, and its logs must include a trace ID field.
To leverage this feature, we’ll need charmed tempo HA and charmed loki HA to handle the correlation between traces and logs, and charmed grafana to provide the user interface where this correlation can be explored.
Production Setup
The plan is for COS to come with this feature enabled by default.
See more: Deploy COS using terraform
When you deploy COS using its terraform module, you’ll automatically get all the required integrations needed to enable trace-to-logs correlation.
If you manually created the terraform module or deployed COS without using it, you should be able to enable the feature by running a single command:
juju integrate tempo:receive-datasource loki
Development Setup
For testing purposes, instead of deploying the entire stack, you can use the commands below to deploy a lighter setup. This minimal deployment includes only the required charms and integrations needed to enable the trace-to-log feature.
# deploy a testing tempo cluster
juju deploy tempo-coordinator-k8s tempo --trust  --channel 2/edge
juju deploy tempo-worker-k8s tempo-worker --channel 2/edge --trust
juju deploy seaweedfs-k8s tempo-fs --channel latest/edge
juju integrate tempo tempo-fs
juju integrate tempo tempo-worker

# deploy a testing loki cluster
juju deploy loki-coordinator-k8s loki --trust  --channel 2/edge
juju deploy loki-worker-k8s loki-worker --channel 2/edge --trust
juju deploy seaweedfs-k8s loki-fs --channel latest/edge
juju integrate loki loki-fs
juju integrate loki loki-worker

# deploy grafana
juju deploy grafana-k8s grafana --trust --channel 2/edge

# integrations
juju integrate loki:grafana-source grafana
juju integrate tempo:grafana-source grafana
juju integrate tempo:receive-datasource loki
The crucial integration to enable this telemetry correlation feature is the one between Tempo and Loki, allowing them to exchange the datasource UIDs they need to cross-reference trace IDs.
See more: grafana_datasource_exchange
Deploy a charmed workload to observe the correlation
For this example, we’ll be using charmed pyroscope to observe the correlation between its logs and traces, but you can deploy any charmed workload that:
- Provides its workload logs over the loki_push_api interface.
- Provides its workload traces over the tracing interface.
- Its workload is instrumented to generate logs with a trace ID field. What that looks like depends on the specific workload and the language it’s written in.
# deploy a testing pyroscope cluster
juju deploy pyroscope-coordinator-k8s pyroscope --trust  --channel 2/edge
juju deploy pyroscope-worker-k8s pyroscope-worker --channel 2/edge --trust
juju deploy seaweedfs-k8s pyroscope-fs --channel latest/edge
juju integrate pyroscope pyroscope-fs
juju integrate pyroscope pyroscope-worker

juju integrate pyroscope:logging loki
juju integrate pyroscope:workload-tracing tempo
Explore the telemetry data in the Grafana UI
Open the Grafana web UI from your local web browser and login using the admin password.
Then, go to Toggle Menu → Explore → select your Tempo datasource → Add filters to view traces from your charmed workload → Run query
When you expand a trace, you’ll see a link icon next to each span that lets you jump directly to the logs related to that span, as shown in the figure below.
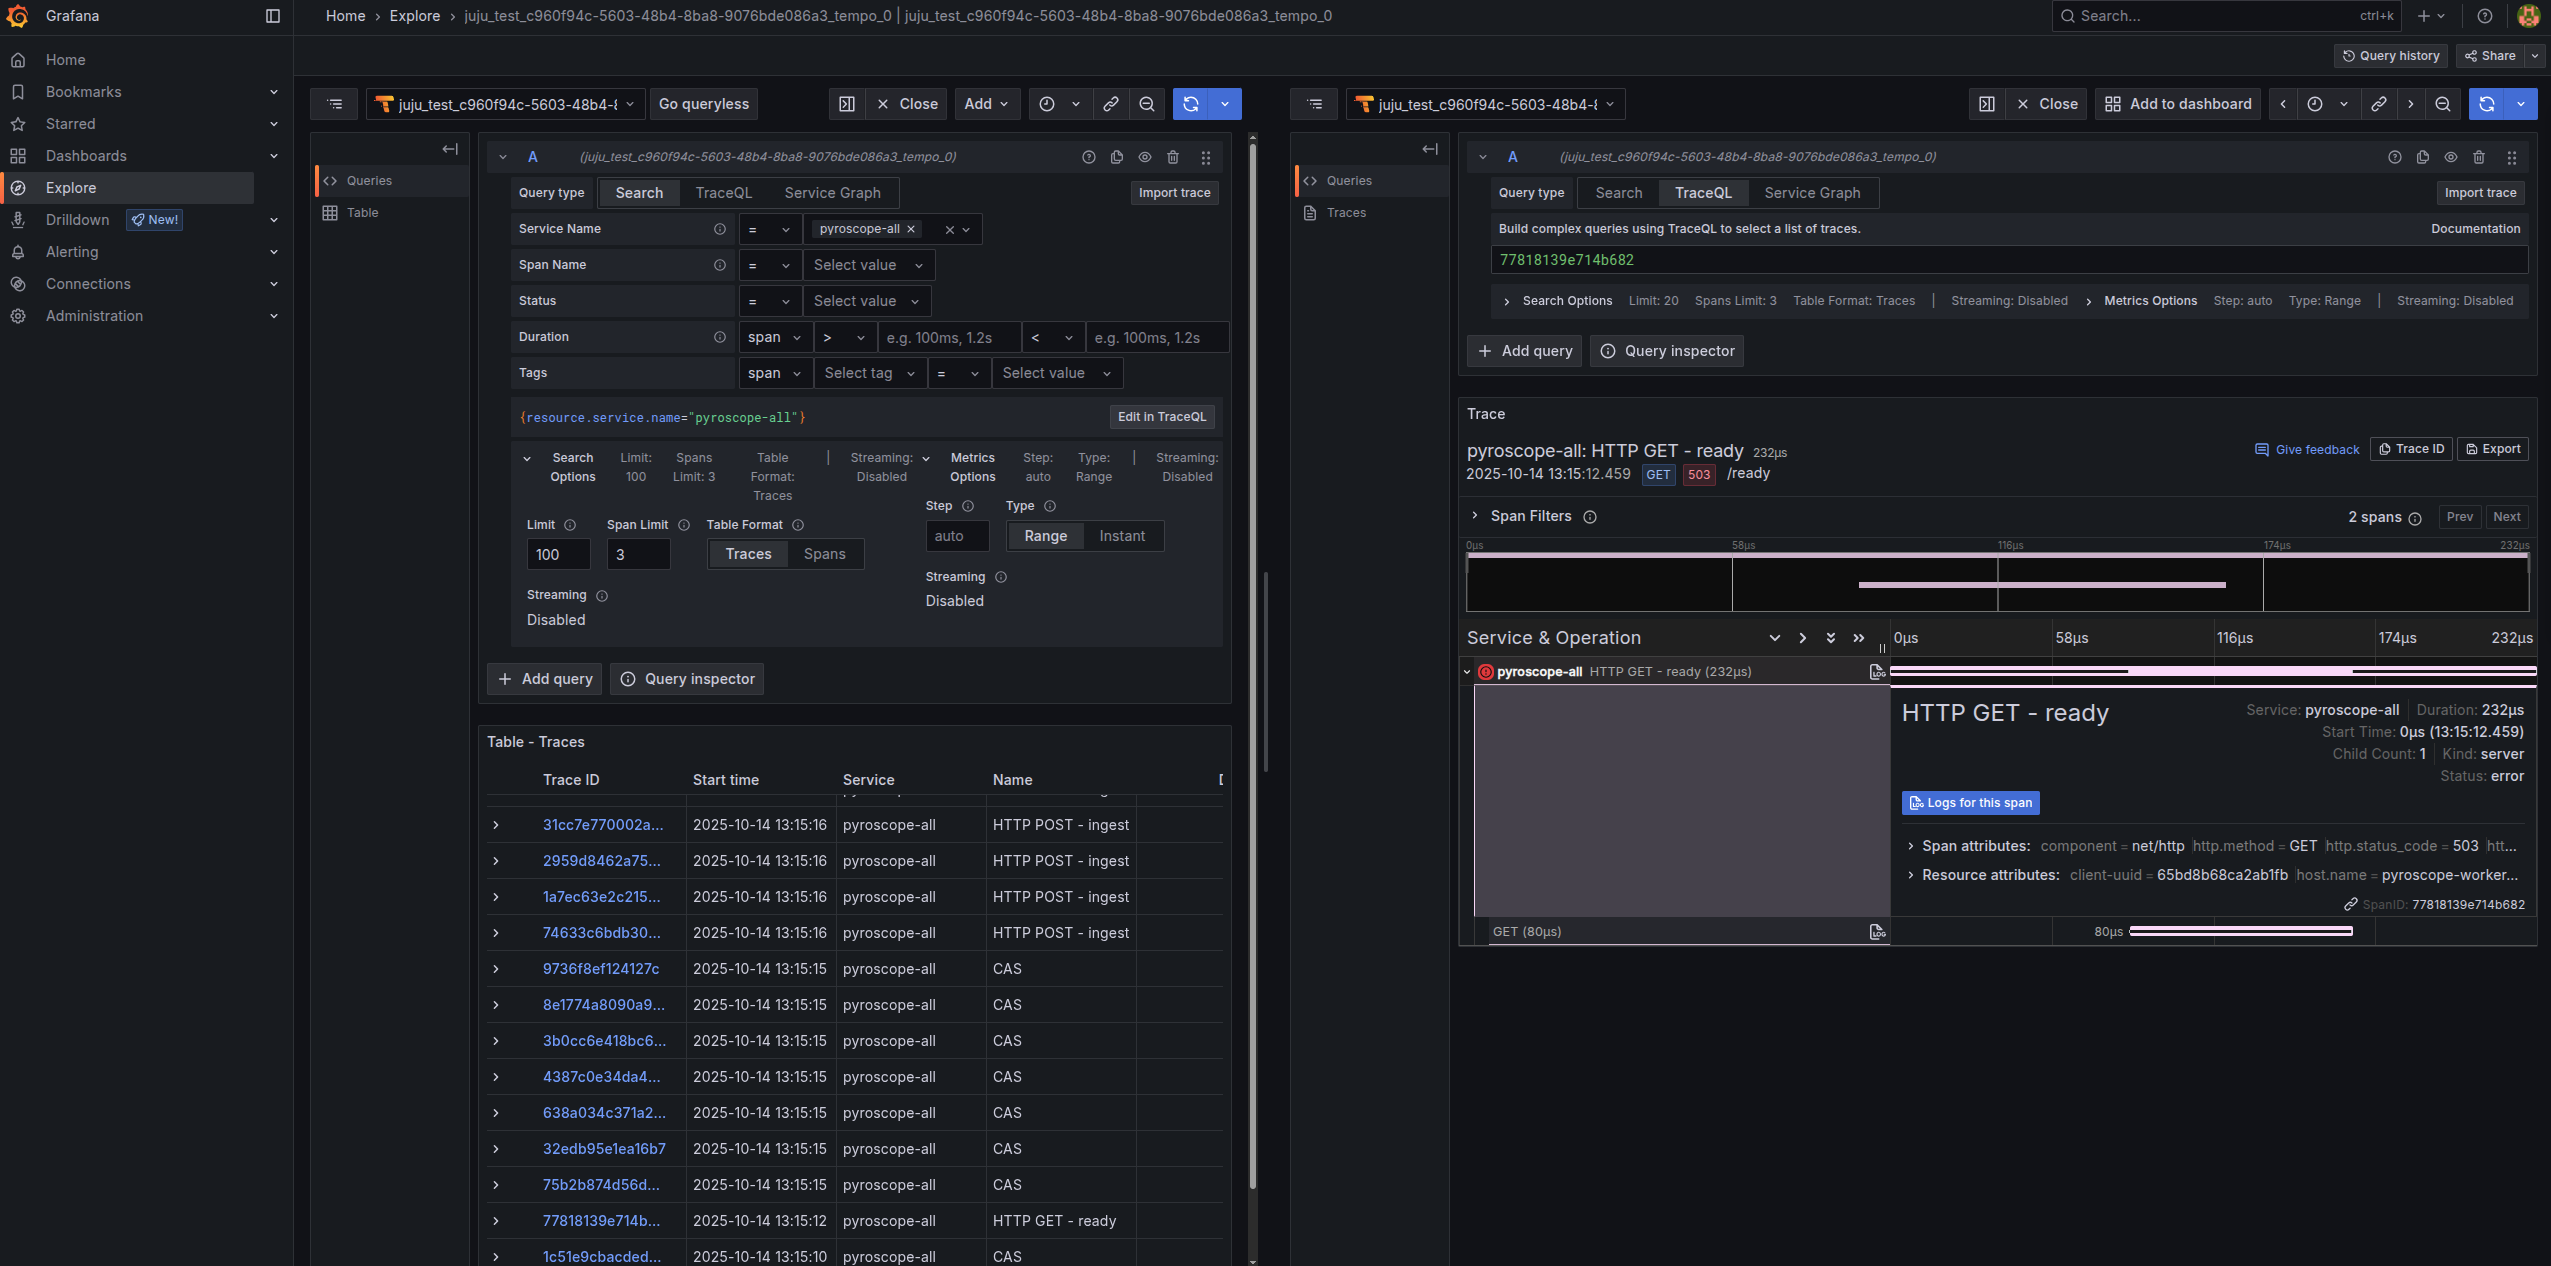
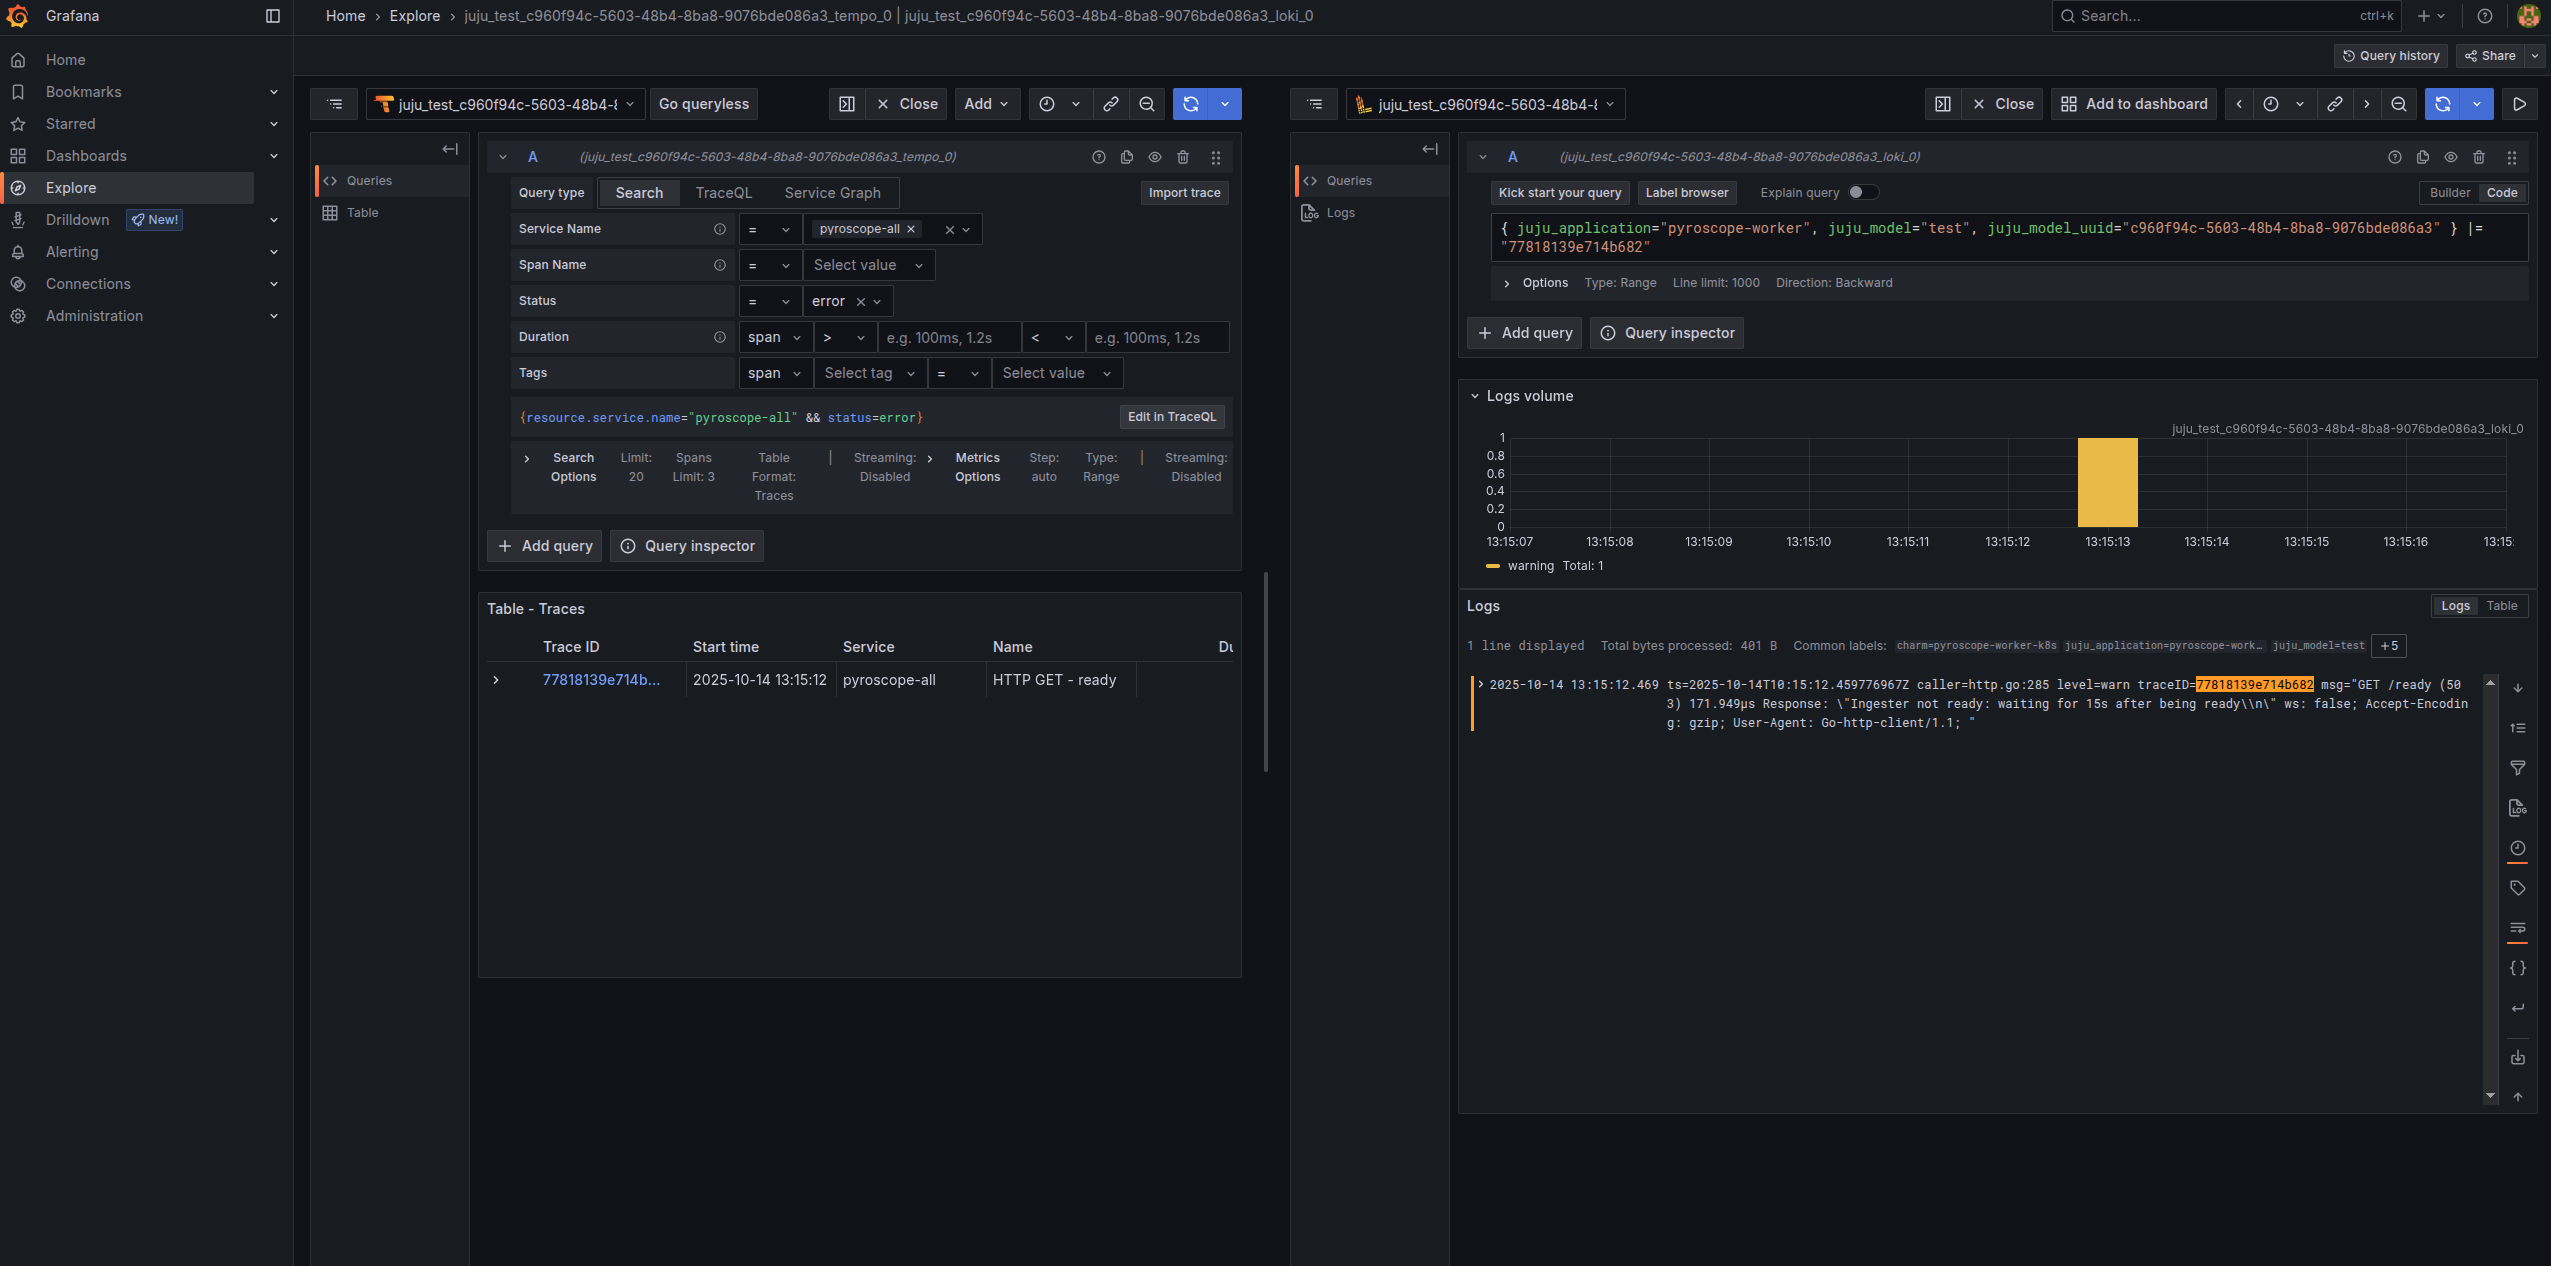
If the span has corresponding logs, clicking Logs for this span will take you to a view that queries and displays those logs, as shown below.
Last updated 8 months ago.