
Tempo HA docs - How to enable correlation from traces to metrics
Grafana supports a trace-to-metrics correlation feature that lets you navigate from a span in a trace view to metrics relevant for that span to make troubleshooting issues easier.
See more: Grafana trace-to-metrics
In Grafana, traces are linked to metrics by running a custom query that uses tags from the span. We use the
juju_topologytags that are added to both spans and metrics. This lets us do a simple “get all metrics” query using those tags to grab all the metrics coming from the same service that created the span, during the same time window.
See more: Juju topology
To leverage this feature, we’ll need charmed Tempo HA and charmed Mimir to store traces and metrics, and charmed Grafana to run the dashboard where we can view and explore them.
Production Setup
The plan is for COS to come with this feature enabled by default.
See more: Deploy COS using terraform
When you deploy COS using its latest terraform module, you’ll automatically get all the required integrations needed to enable trace-to-metrics correlation.
Development Setup
For testing purposes, instead of deploying the entire stack, you can use the commands below to deploy a lighter setup. This minimal deployment includes only the required charms and integrations needed to enable and try out the trace-to-metrics feature.
# deploy a testing tempo cluster
juju deploy tempo-coordinator-k8s tempo --trust  --channel 2/edge
juju deploy tempo-worker-k8s tempo-worker --channel 2/edge --trust
juju deploy seaweedfs-k8s tempo-fs --channel latest/edge
juju integrate tempo tempo-fs
juju integrate tempo tempo-worker

# deploy a testing mimir cluster
juju deploy mimir-coordinator-k8s mimir --trust  --channel 2/edge
juju deploy mimir-worker-k8s mimir-worker --channel 2/edge --trust
juju deploy seaweedfs-k8s mimir-fs --channel latest/edge
juju integrate mimir mimir-fs
juju integrate mimir mimir-worker

# deploy grafana
juju deploy grafana-k8s grafana --trust --channel 2/edge

# integrations
juju integrate mimir:grafana-source grafana
juju integrate tempo:grafana-source grafana
juju integrate tempo:receive-datasource mimir
The crucial integration to enable this telemetry correlation feature is the one between Tempo and Mimir, allowing them to exchange the datasource UIDs needed by grafana to know which custom custom queries to run to fetch metrics for a given trace.
See more: grafana_datasource_exchange
Deploy a charmed workload to observe the correlation
For this example, we’ll be using charmed Pyroscope to observe the correlation between its traces and metrics, but you can deploy any charmed workload that:
- Provides its workload metrics over the prometheus_scrape interface or the prometheus_remote_write interface.
- Provides its workload traces over the tracing interface.
# deploy a testing pyroscope cluster
juju deploy pyroscope-coordinator-k8s pyroscope --trust  --channel 2/edge
juju deploy pyroscope-worker-k8s pyroscope-worker --channel 2/edge --trust
juju deploy seaweedfs-k8s pyroscope-fs --channel latest/edge
juju integrate pyroscope pyroscope-fs
juju integrate pyroscope pyroscope-worker

# deploy an otel collector that will scrape metrics
juju deploy opentelemetry-collector-k8s otelcol --trust --channel 2/edge
juju integrate otelcol:send-remote-write mimir

juju integrate pyroscope:metrics-endpoint otelcol
juju integrate pyroscope:workload-tracing tempo
Explore the telemetry data in the Grafana UI
Open the Grafana web UI from your local web browser and login using the admin password.
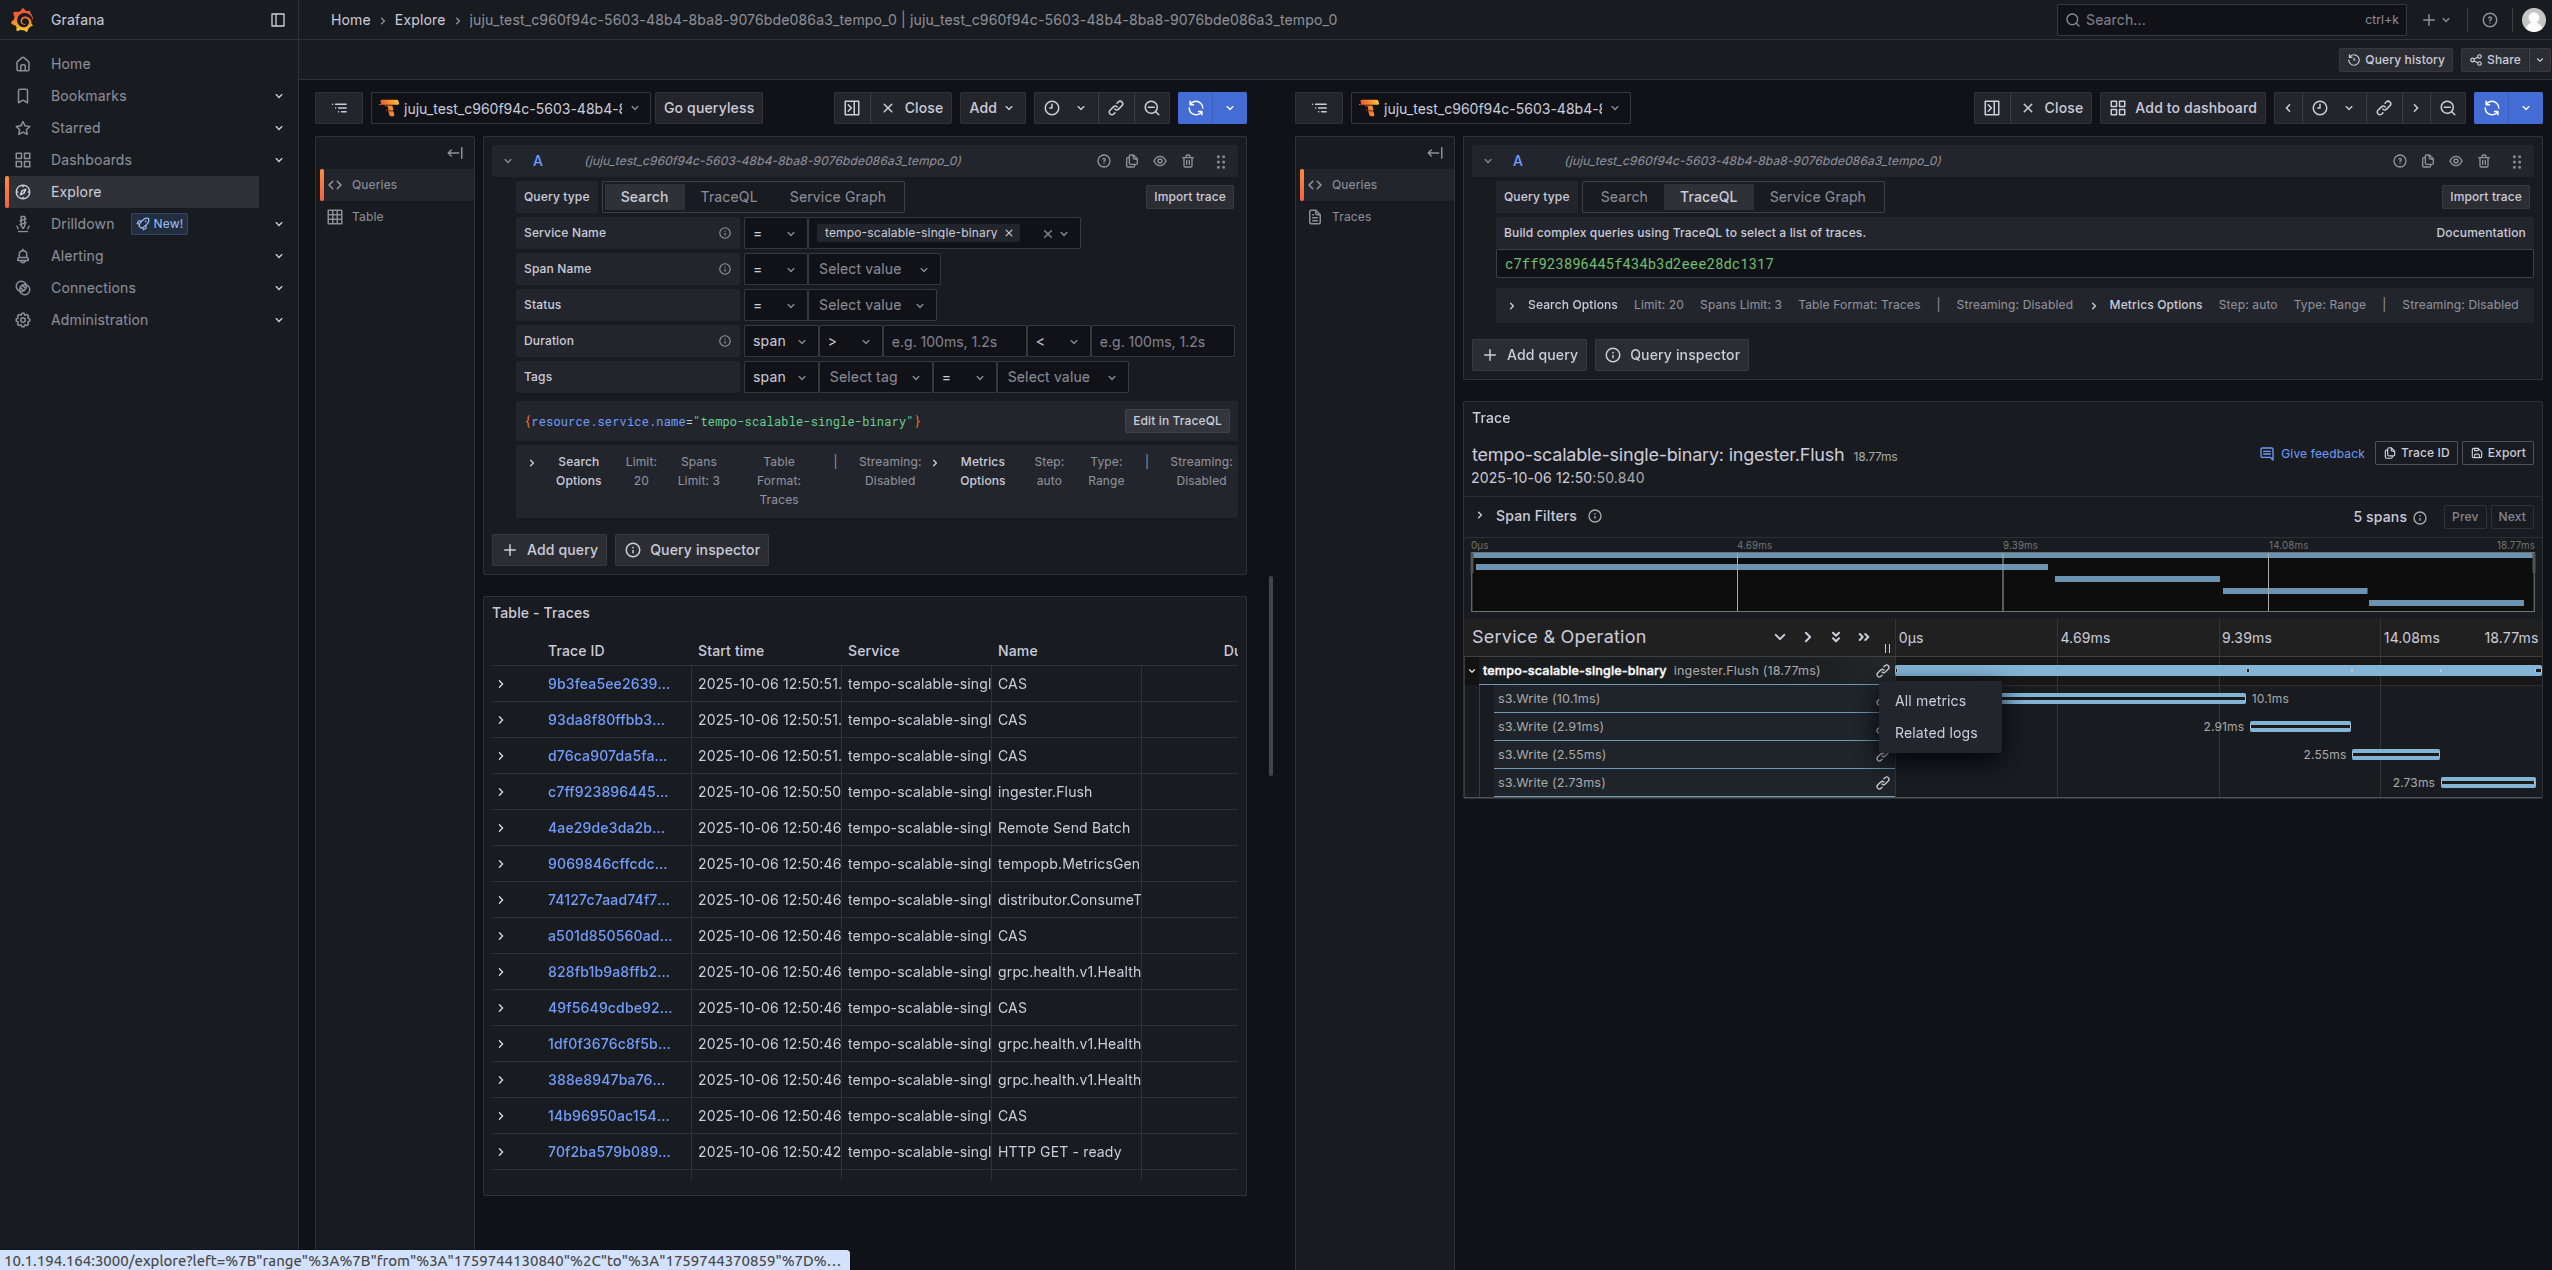
Then, go to Toggle Menu → Explore → select your Tempo datasource → Add filters to view traces from your charmed workload → Run query
When you expand any trace, each span will now have a link to All metrics that will fetch all metrics relevant to that span, as shown in the figure below.
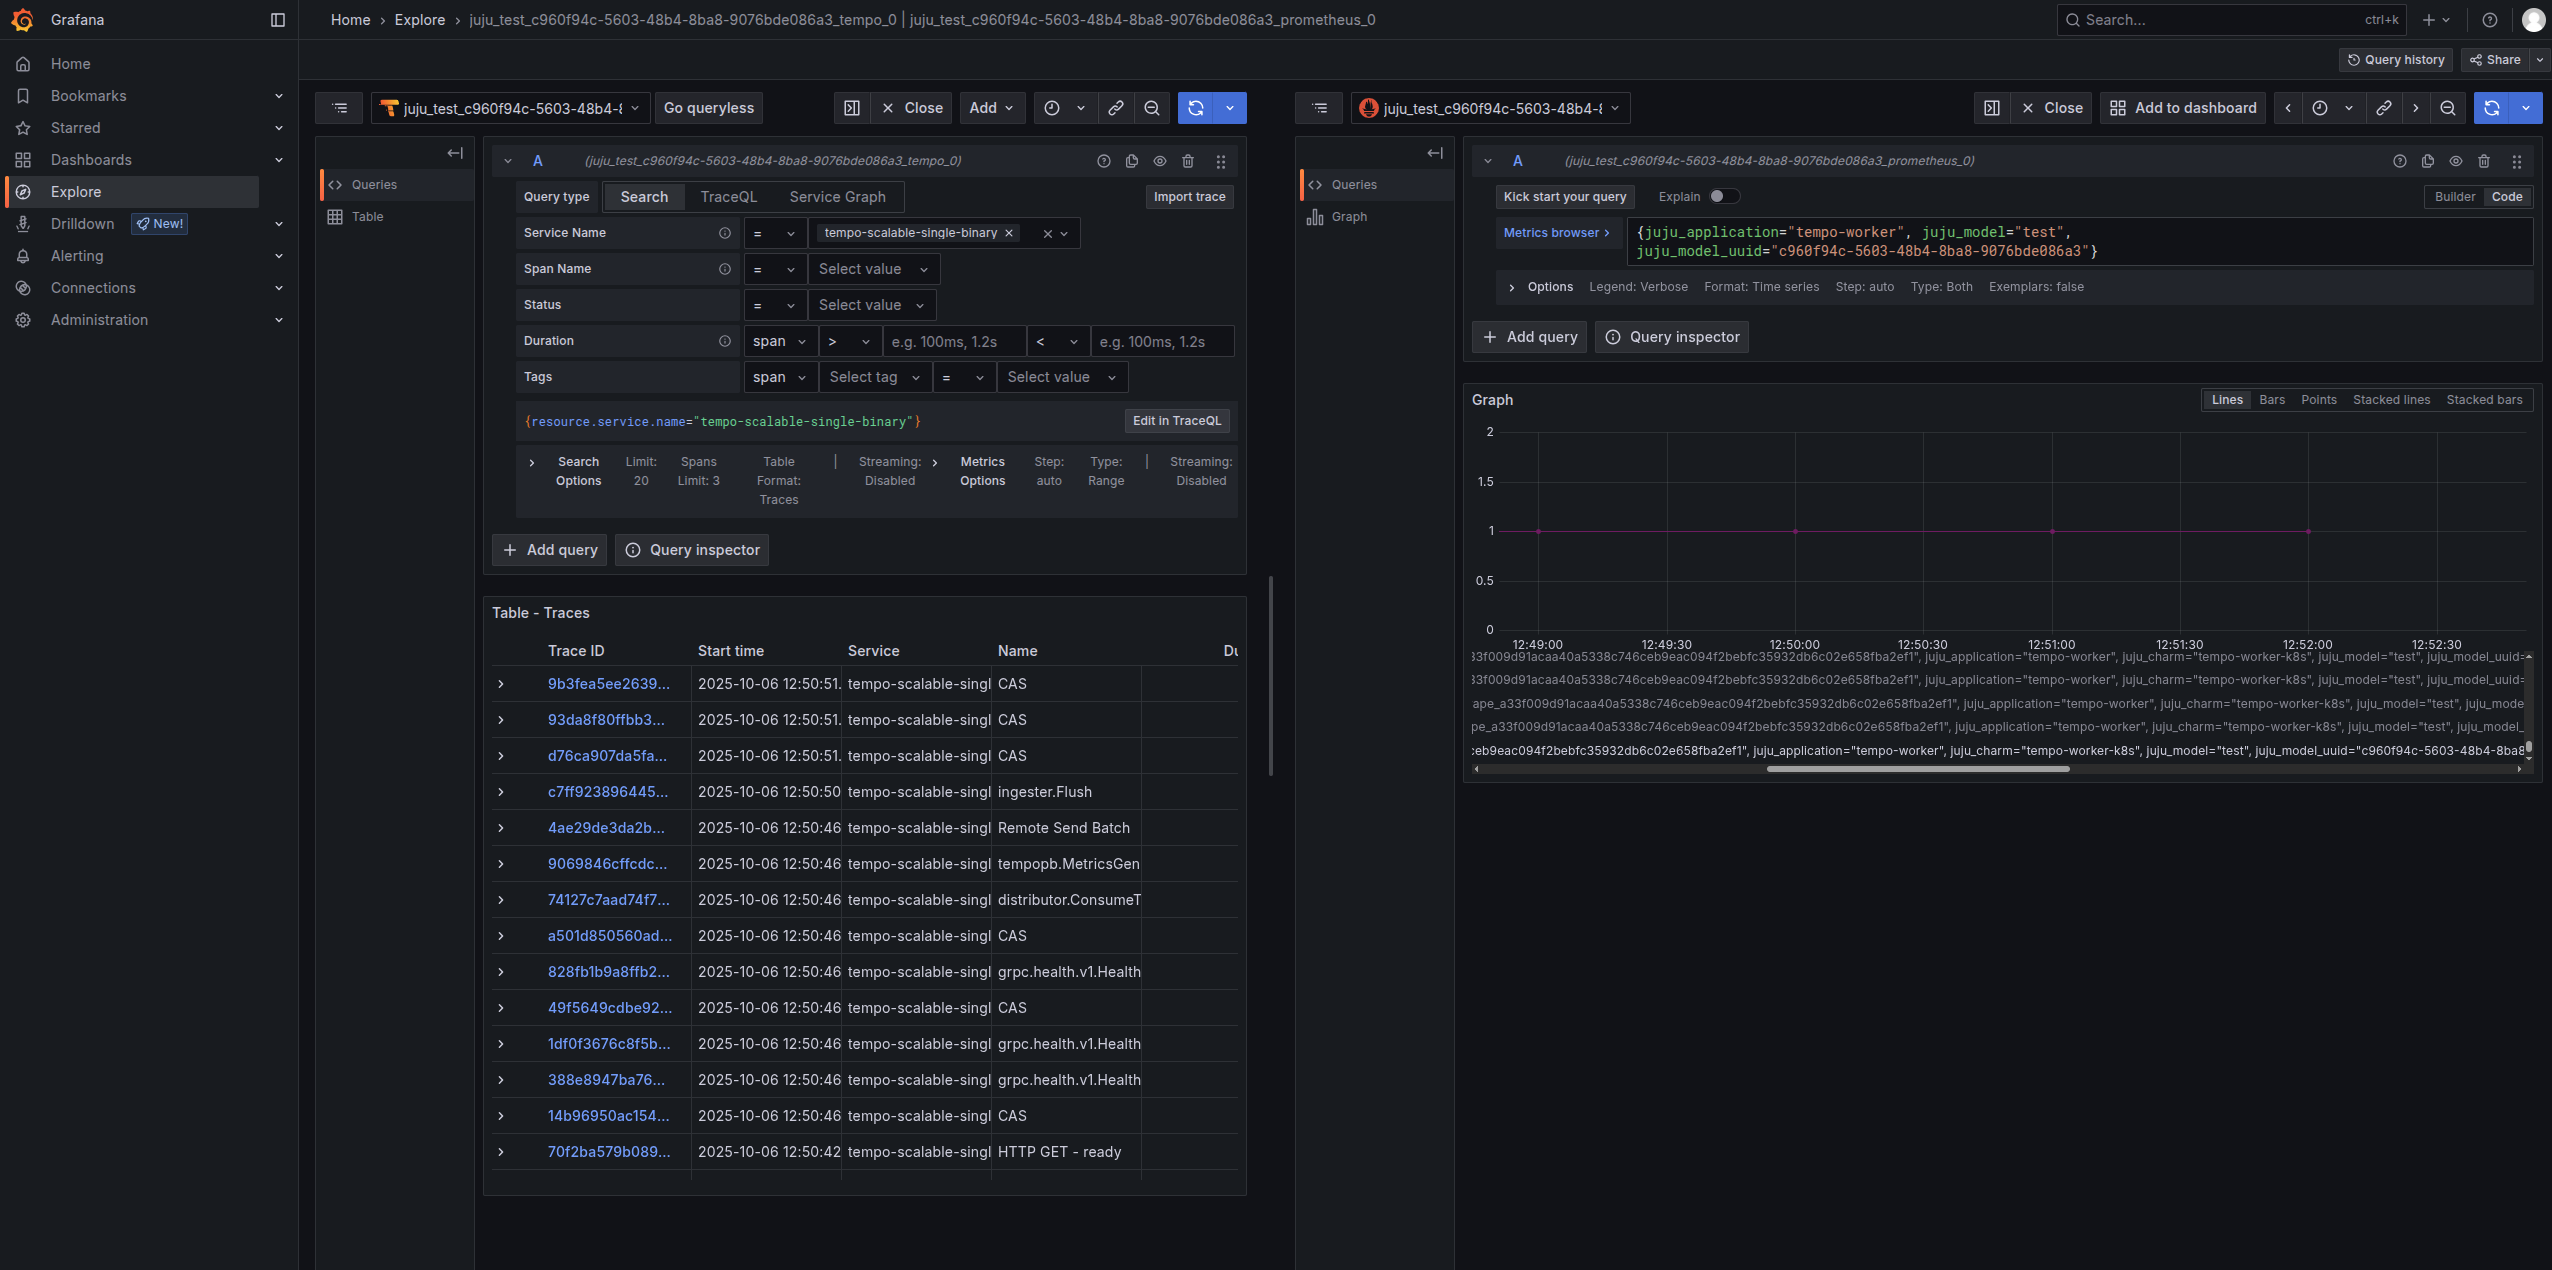
Clicking that link will run the metrics query in a split panel, as shown below.
Last updated 8 months ago.