
Using the Grafana Agent Machine Charm
Metadata
| Key | Value |
|---|---|
| Summary | Using the Grafana Agent Machine Charm |
| Categories | integrations |
| Difficulty | 3 |
| Author | Jose Massón |
- Preview
- About Grafana Agent machine charm
- Step 0: Understanding the desired situation
- Step 1: Make sure COS Lite is up and running.
- Step 2: Instrument Grafana Agent in our Application’s Charmed Operator
- Step 3: Deploy Zookeeper and Grafana Agent in our VM Juju model.
- Step 4: Relate Grafana Agent to COS-Lite (Prometheus, Loki and Grafana)
- Step 5: Verify that metrics and logs reach Prometheus and Loki
Preview
Initial situation
Let’s assume we have an application that:
- Is running in a virtual machine or in a regular machine.
- Is managed with Juju by its own charm.
- Needs to be observed (monitored).
Desired situation
We would like to collect telemetry from the charmed application into COS Lite, but COS Lite runs in Kubernetes and the application in a machine.
So the question arises: How can we connect both worlds? The answer is simple: use this Grafana Agent machine charm!
The Grafana Agent machine charm
The Grafana Agent machine charm handles installation, configuration, and Day 2 operations specific to Grafana Agent, using Juju and the Charmed Operator Lifecycle Manager (OLM).
This charm was designed to run in virtual machines as a subordinate. Application units are typically run in an isolated container on a machine with no knowledge or access to other applications deployed onto the same machine. With subordinate charms, units of different applications to be deployed into the same container and to have knowledge of each other. Subordinate units scale together with their principal.
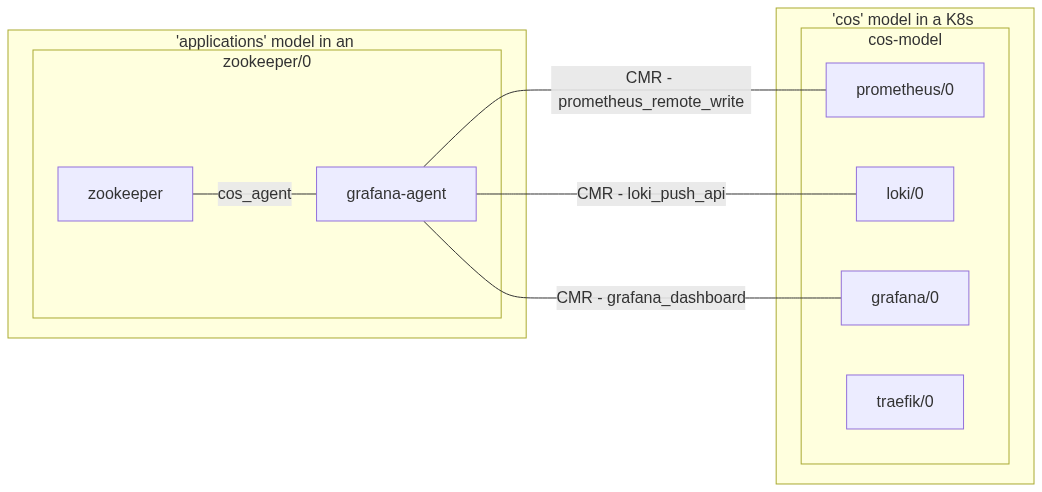
Step 0: Understanding the desired situation
As we said before, we are going to use COS Lite to monitor our application, and Grafana Agent machine charm to send application’s telemetry (metris, logs and dashboards)
For that we will have two Juju models:
applications, on a lxd controller, for our application and grafana agentcos, on a k8s controller, for COS Lite
Step 1: Make sure COS Lite is up and running.
We have to make sure that the observability stack is up and running in our cos model (follow the instructions in COS Lite) in a K8s controller, like this:
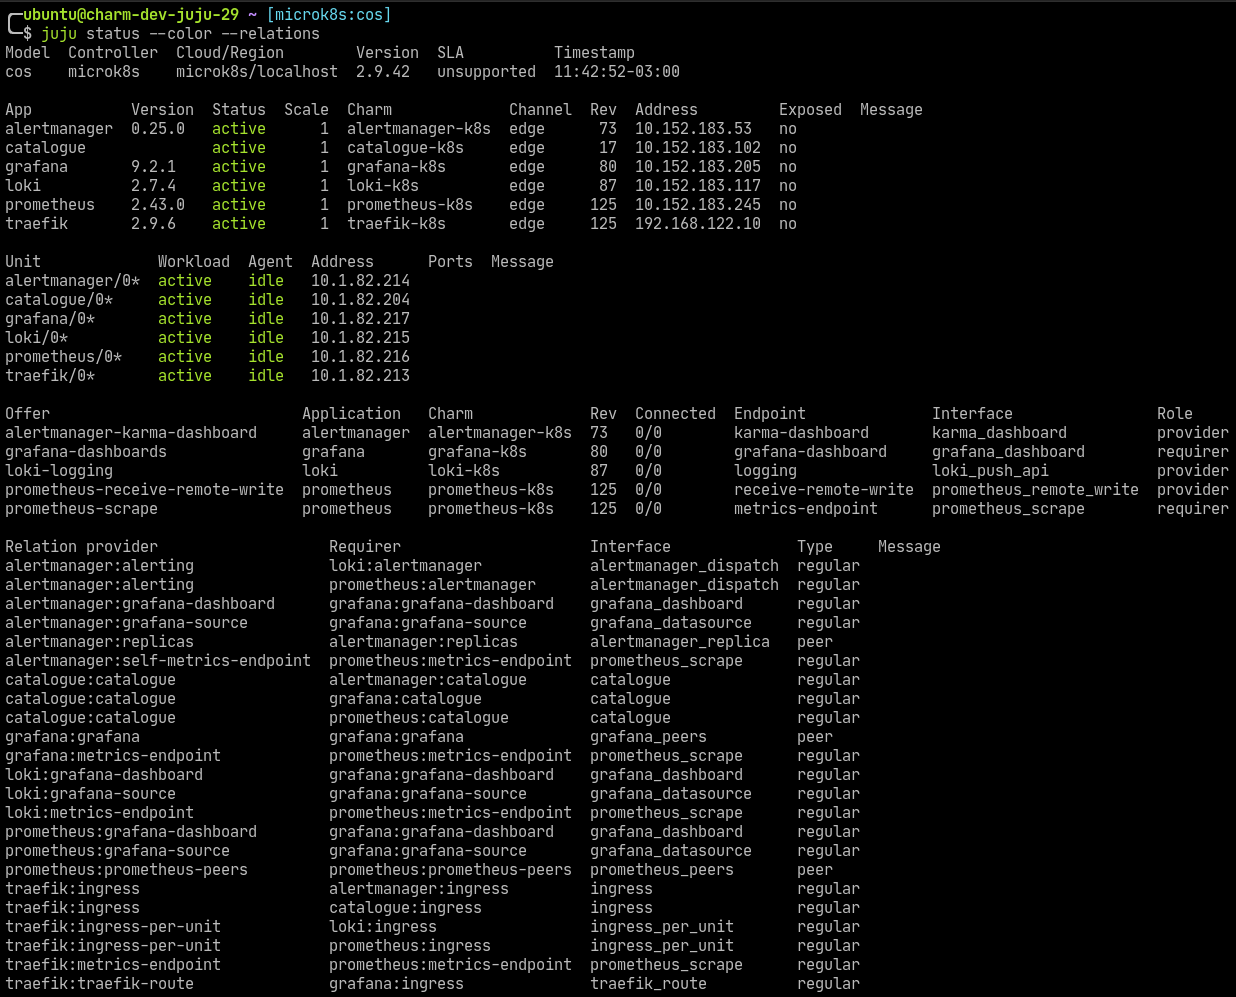
Note that COS Lite is offering several interfaces so we can create cross-model relations with applications that are running in different controllers/models:
Offer                            Application   Charm             Rev  Connected  Endpoint              Interface                Role
alertmanager-karma-dashboard     alertmanager  alertmanager-k8s  73   0/0        karma-dashboard       karma_dashboard          provider
grafana-dashboards               grafana       grafana-k8s       80   0/0        grafana-dashboard     grafana_dashboard        requirer
loki-logging                     loki          loki-k8s          87   0/0        logging               loki_push_api            provider
prometheus-receive-remote-write  prometheus    prometheus-k8s    125  0/0        receive-remote-write  prometheus_remote_write  provider
prometheus-scrape                prometheus    prometheus-k8s    125  0/0        metrics-endpoint      prometheus_scrape        requirer
Step 2: Instrument Grafana Agent in our Application’s Charmed Operator
In this example we use COS Lite to observe Zookeeper.
In order to instrument it, we will have to:
-
Obtain
cos_agentlib fromgrafana-agentcharm:charmcraft fetch-lib charms.grafana_agent.v0.cos_agent -
Modify only 2 files in your machine charm code:
metadata.yaml,src/charm.py.In
metadata.yamlwe need to add toprovidessection:cos-agent: interface: cos_agentIn
src/charm.pywe import the library:from charms.grafana_agent.v0.cos_agent import COSAgentProviderand instantiate
COSAgentProviderobject in__init__method. For zookeeper it may look like this:self._grafana_agent = COSAgentProvider( self, metrics_endpoints=[ {"path": "/metrics", "port": NODE_EXPORTER_PORT}, {"path": "/metrics", "port": JMX_PORT}, {"path": "/metrics", "port": METRICS_PROVIDER_PORT}, ], metrics_rules_dir="./src/alert_rules/prometheus", logs_rules_dir="./src/alert_rules/loki", dashboard_dirs=["./src/grafana_dashboards"], log_slots=["charmed-zookeeper:logs"], )Note that you can specify the paths where metrics and logs alert rules and dashboards files are stored. In order to know how alert rules and dashboards are written, check these examples.
-
Re-pack the charm:
charmcraft pack
and voilà!
Step 3: Deploy Zookeeper and Grafana Agent in our VM Juju model.
In order to deploy these applications make sure you already have a VM Juju controller bootstrapped.
In this controller we will create a new model named for instance applications
and deploy (and relate) zookeeper and grafana-agent.
-
Create the model:
$ juju add-model applications Added 'applications' model on localhost/localhost with credential 'localhost' for user 'admin' -
Deploy Zookeeper using the previous packed
*.charmfile:$ pwd /home/ubuntu/repos/zookeeper-operator $ juju deploy ./*.charm zookeeper Located local charm "zookeeper", revision 0 Deploying "zookeeper" from local charm "zookeeper", revision 0 on jammy -
Deploy Grafana Agent machine charm
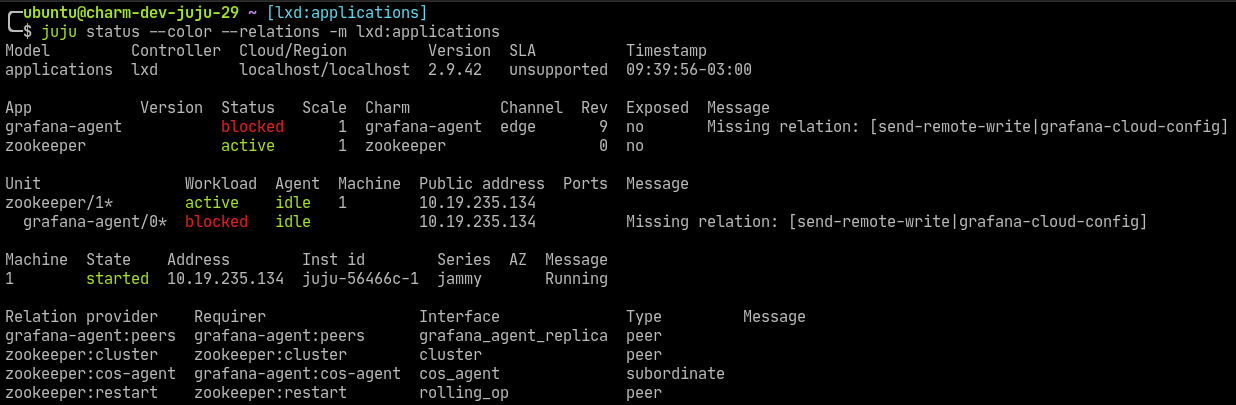
juju deploy grafana-agent --channel edgeAfter running these commands the status of the model will be active/idle for both units:
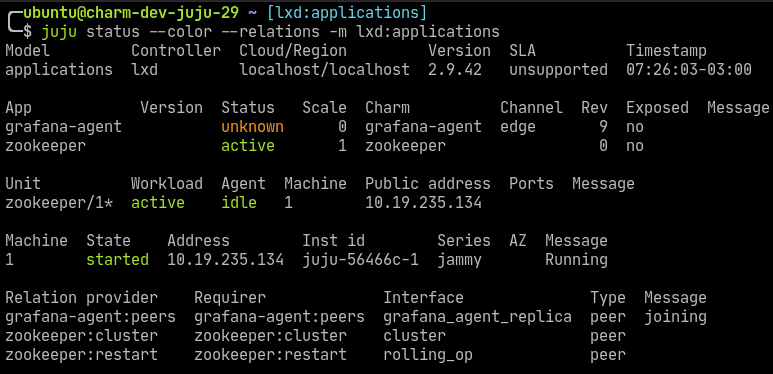
At this point we have one
zookeeperunit inactivestate, and there is nografana-agentunits. This is becausegrafana-agentis a subordinate application. -
Relate
zookeepertografana-agentover thecos-agentrelation:juju relate zookeeper:cos-agent grafana-agentOnce the relation is established, and
grafana-agentis deployed insidezookeeperunit, the status of the model will be: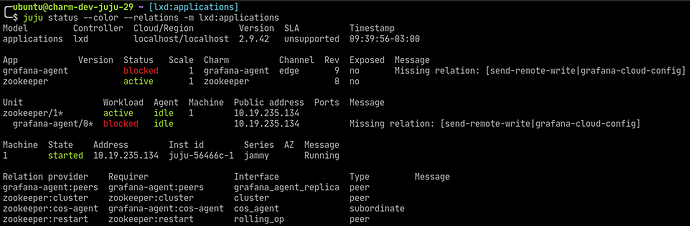
Note that despite of the fact at this point
grafana-agentis collecting telemetry data fromzookeeperit is not forwarding them to the COS Lite deployment we have in the K8s controller.
Step 4: Relate Grafana Agent to COS-Lite (Prometheus, Loki and Grafana)
Since Grafana Agent is meant to send telemetry to COS-Lite, the next step is to relate Grafana Agent to the COS Lite components: Prometheus, Loki and Grafana. This charm need these three relations.
From the model our application is running, we can verify the offers COS Lite is exposing:
$ juju find-offers -m microk8s:cos

Store     URL                                        Access  Interfaces
microk8s  admin/cos.loki-logging                     admin   loki_push_api:logging
microk8s  admin/cos.prometheus-receive-remote-write  admin   prometheus_remote_write:receive-remote-write
microk8s  admin/cos.prometheus-scrape                admin   prometheus_scrape:metrics-endpoint
microk8s  admin/cos.alertmanager-karma-dashboard     admin   karma_dashboard:karma-dashboard
microk8s  admin/cos.grafana-dashboards               admin   grafana_dashboard:grafana-dashboard
As we said before, we will use only three of these offers:
- Prometheus:
admin/cos.prometheus-receive-remote-write - Loki:
admin/cos.loki-logging - Grafana:
admin/cos.grafana-dashboards
The first step to use these offers is to consume them:
$ juju consume microk8s:admin/cos.prometheus-receive-remote-write
Added microk8s:admin/cos.prometheus-receive-remote-write as prometheus-receive-remote-write
$ juju consume microk8s:admin/cos.loki-logging
Added microk8s:admin/cos.loki-logging as loki-logging
$ juju consume microk8s:admin/cos.grafana-dashboards
Added microk8s:admin/cos.grafana-dashboards as grafana-dashboards
Once these commands are executed, the status of our model will change slightly:
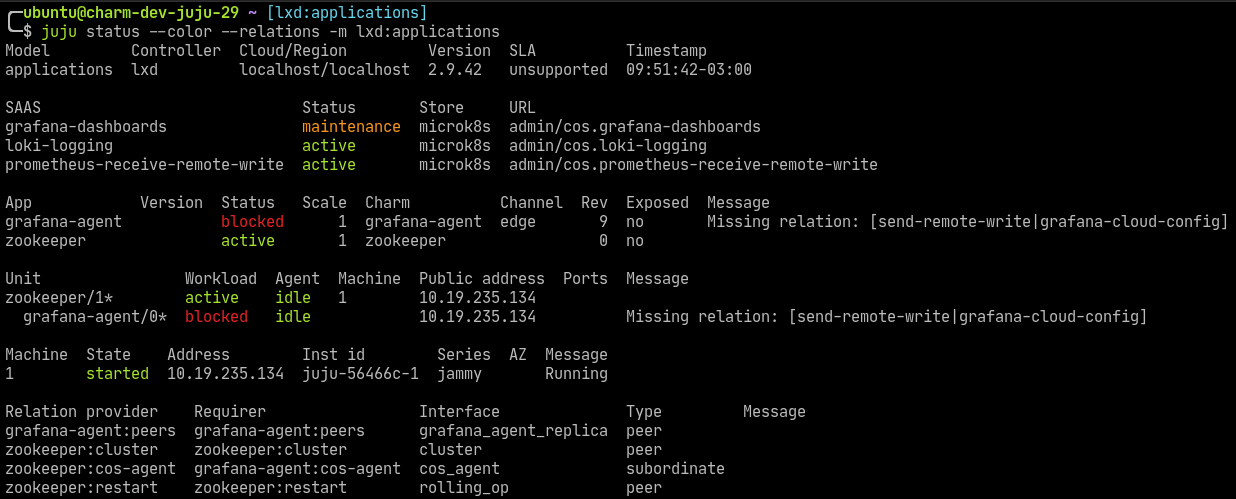
Note that in the status we now have a new section named SAAS. In that section we can see all the interfaces offered by other applications running in other models that we can integrate to.
So now let’s relate Grafana Agent with these 3 applications:
juju relate grafana-agent prometheus-receive-remote-write
juju relate grafana-agent loki-logging
juju relate grafana-agent grafana-dashboards
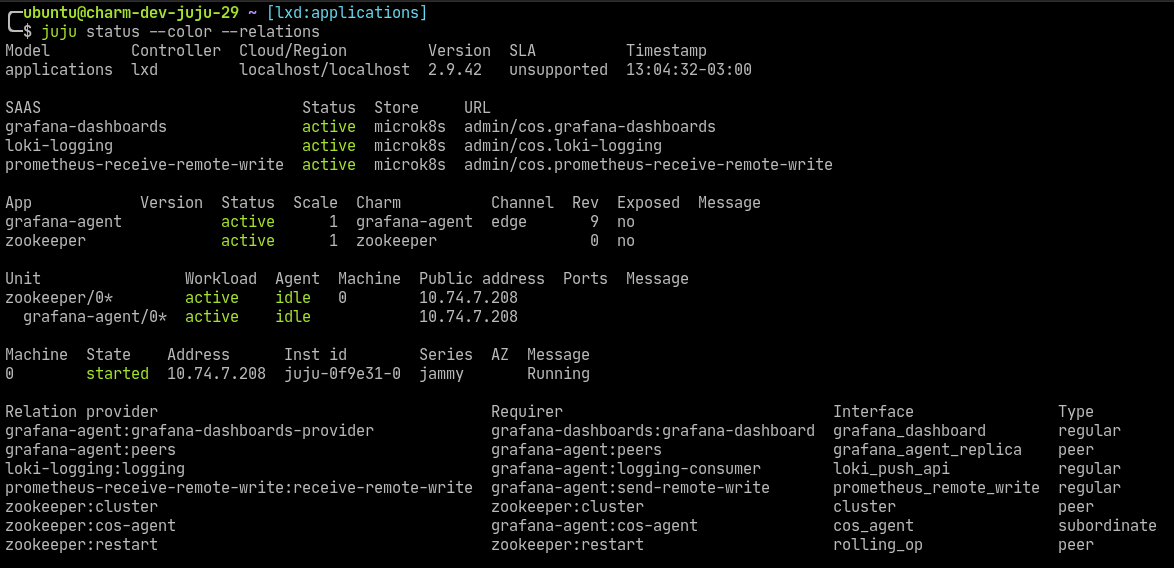
And the three new relations are established, see the relations sections of the model status:
Note that because of this bug you can’t create a new offer after relating an existing one. So first create all offers you intend to consume, and then relate all endpoints. Otherwise juju will complain with: ERROR cannot update application offer "<app>": application endpoint "<endpoint>" has active consumers
Step 5: Verify that metrics and logs reach Prometheus and Loki
Now that the Cross Model Relations are established between our application model and our Observability model, we can easily verify that the metrics zookeeper exposes reaches Prometheus:

$ curl -s http://192.168.122.10/cos-prometheus-0/api/v1/query\?query\=zookeeper_DataDirSize | jq
{
  "status": "success",
  "data": {
    "resultType": "vector",
    "result": [
      {
        "metric": {
          "__name__": "zookeeper_DataDirSize",
          "instance": "applications_f201dfb6-896c-4d5e-83c0-55e6bb8b08f3_zookeeper_zookeeper/0",
          "job": "zookeeper_1",
          "juju_application": "zookeeper",
          "juju_model": "applications",
          "juju_model_uuid": "f201dfb6-896c-4d5e-83c0-55e6bb8b08f3",
          "juju_unit": "zookeeper/0",
          "memberType": "Leader",
          "replicaId": "1"
        },
        "value": [
          1678971938.463,
          "67108880"
        ]
      }
    ]
  }
}
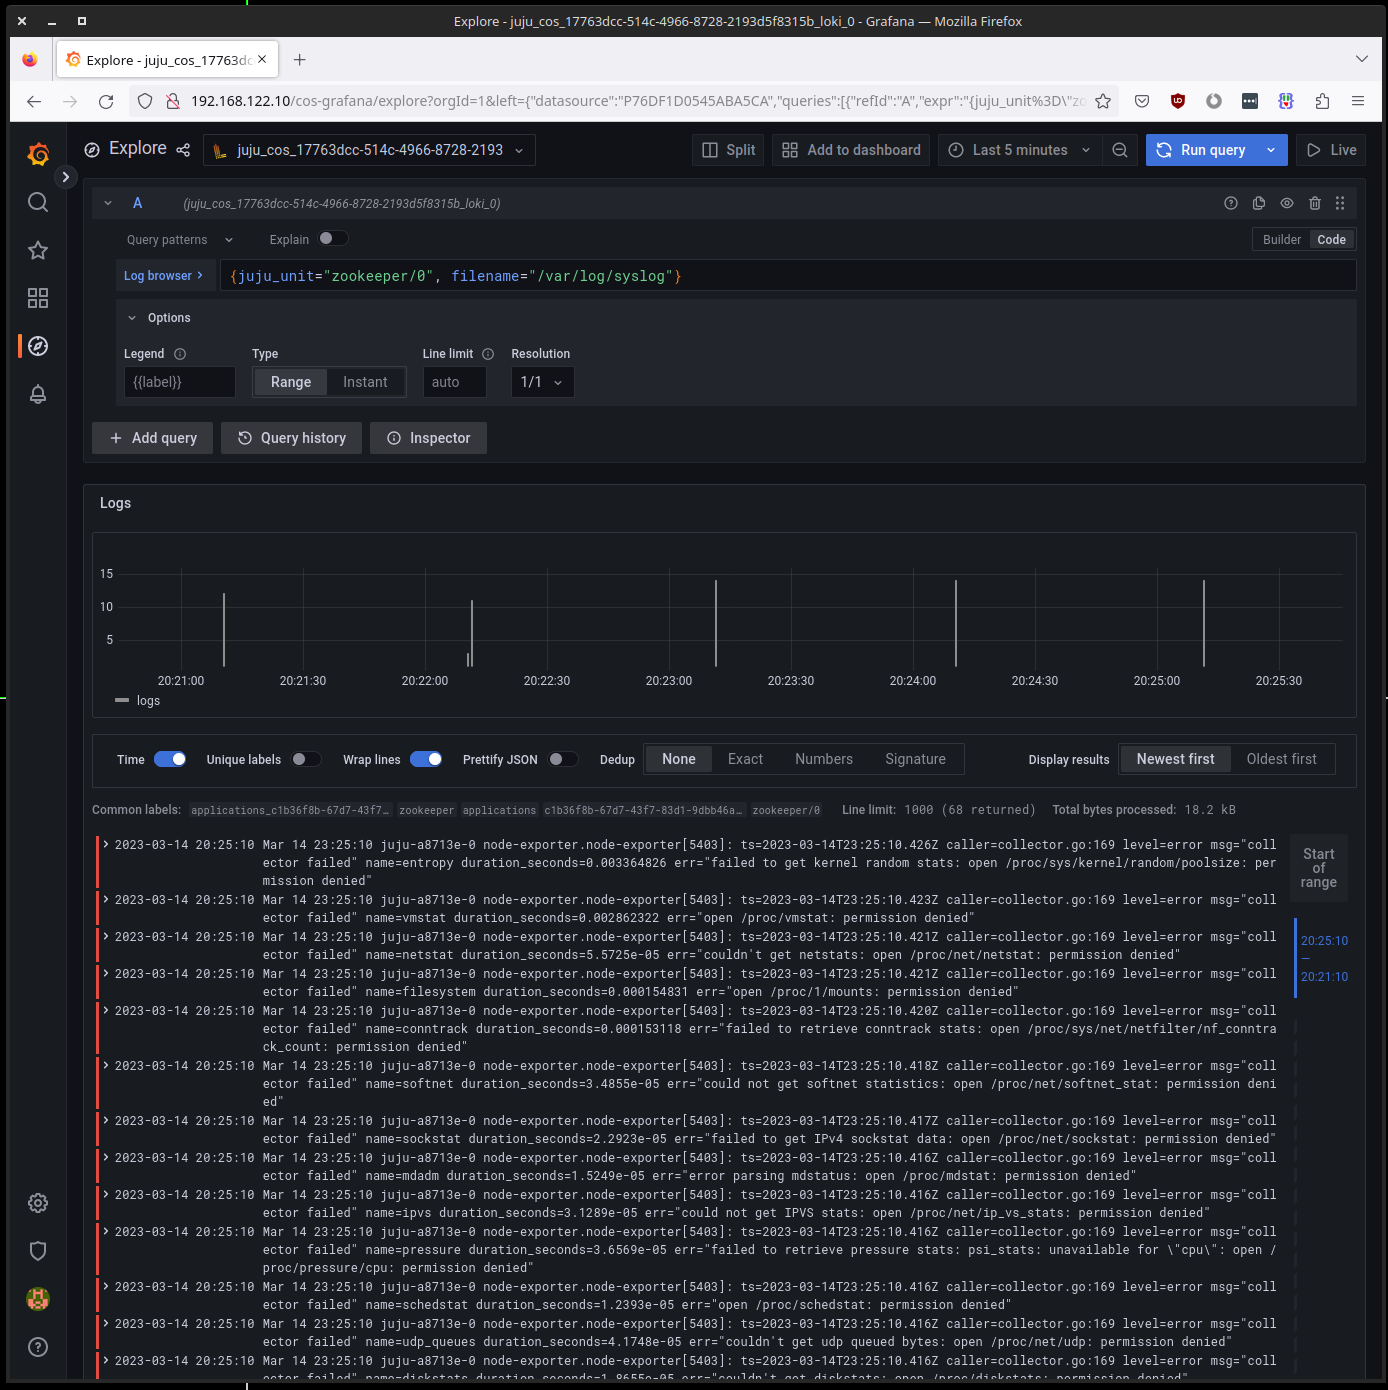
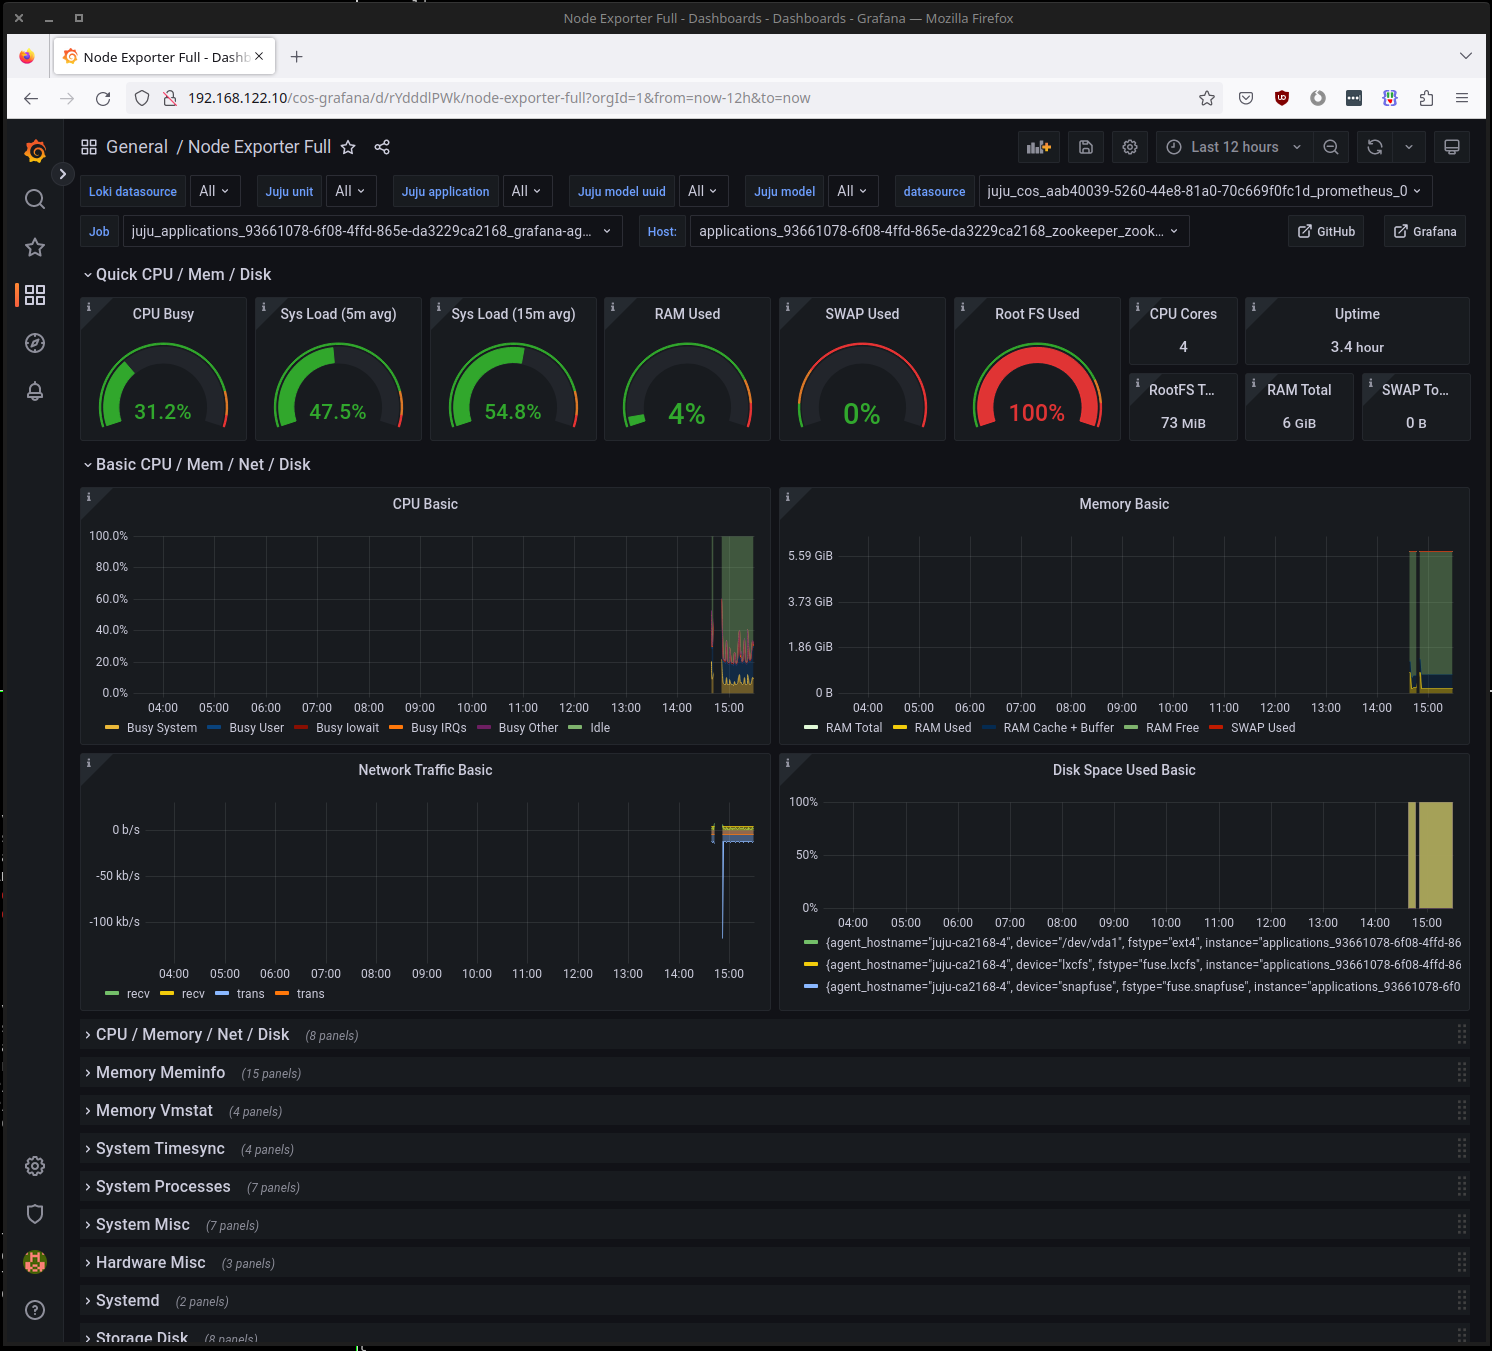
We can also check that the logs are being sent to Loki, in this case using Grafana:
And finally, we can verify the dashboards Zookeepers provides:
Last updated 1 year, 9 days ago.